!date
What's up and welcome to
day 19 stalkers!!
Let's jump in.
First everything below the next line was written before today and might have been revised to make this semi appropriate for a post (not that there was anything especially naughty in it before, just cleaning it up a bit).
Let me give some context. I write a fair bit outside of writing these amazing blog post for you, my stalker(s). I write to chronicle things that are happening in life and what you'll soon see, to understand some crapy code crap that I don't yet understand.
Writing is the way I interact with the thoughts in my head. Sometimes I use pen and paper, sometimes I tickle the keys but it's the one thing I do to understand stuff.
I like to do it. Writing that is. Also as you have probably figured out, I'm pretty phenomenal at it. That's why you keep coming back, don't you?
Creep.
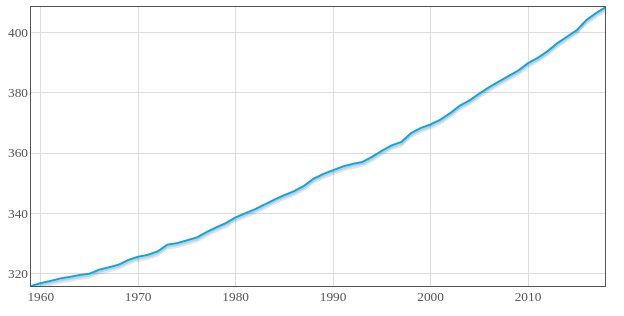
Anyway. Below, one night I felt like I was learning a friggin ton of stuff and I ran into a problem where the author didn't address how they got a bunch of this data into this file to make a graph (oh my me settle down, I've included a graph at the bottom of this post but it only appears if you read everything first). I realized I was going to have to manually edit this text file to display as the author has it displayed in their book and then had a double realization on top of that.
Manual labor on a computer? No flipping way.
So below is me stopping to digest everything I had learned up until that point (the point at which I got stuck), reviewing what I learned and then slowly trying to figure out if I could automate the creation of JavaScript files with what I know how to do in Python and even automate the start of a graphing project like the one I was working on here.
In short: This is the raw workflow from that night. The scene from my evil laboratory
MUAUAHAHAHAHA
enjoy.
I feel like writing so many things but I want to talk about this first.
I have so many resources stock piled in just my twitter messages to myself alone that there is something there.
So I read something kind of reassuring the other day. It said if you don't really know what to build, just copy stuff.
That sounds like pretty good advice and also a great argument against building my own things.
I guess one tends to mess around with what one is familiar with or comfortable doing.
Sometimes exploring into the unknown can be a little scary.
Tonight I worked on some really cool things and had some pretty cool ideas.
I kept working through this Data Vis with JS book I have and I'm starting to learn something along with a little JS.
JS is super confusing. but not hard to figure out. I'm finding bugs slowly (after putting them in there)
However, I probably shouldn't follow this book linearly. That is, in order.
I think that might be a huge problem with people trying to "understand" how to "understand" code. There's no real right way but it is mainly trying to understand things you don't quite understand and then working your way backwards.
Things I've Learned so far in the book
- How to use the inspector to find errors in js. it works like that.
- js arrays/data structures are kind of confusing. They seem almost inconsistent at times. I feel like there are so many brackets and I don't understand what the use is. things seem to work multiple ways and don't other times.
- completing something and having code work feel like a huge breakthrough because of something doesn't show up when you have errors - nothing appears in the browser. so suddenly a picture of a graph shows up and badda bing badda boom - I'm a Data Science and Visualization Analysis Engineer (future title someday).
- also that I need to skip some parts and also work on the beginning parts in my own way.
Also I need to stop drinking soda. Ugh.
The section I want to work on particularly is the first part and automating certain steps in data organization for the javascript graphs.
the reason for this is because the author has some data they are using for the first few graphs but it's not even organized for the tutorial they have. so I'm going to organize it.
# the simplest javascript data structure I've seen looks something like a Python list, just like this.

js_list = [
    [1,'some data point'],
    [2, 'another data point'],
    [3, 'last data point I promise']
]
# next I want to see if I can add that list to a file as a string but save the file as a js file

print(str(js_list))
f = open("js_list_test.js", "w+")
ls
f.close()
f = open("js_list_test.js","a")
f.write("""console.log("test this");""")
cat js_list_test.js
okay this is a little weirder than I thought.
with open("test_js_list.js", "w") as file:
    file.write("""alert("test this");""".strip())
cat test_js_list.js
with open("test_js_list.html", "w+") as html_file:
    html_file.write("""<html>
    <title>some title here</title>
    <script type="text/javascript" src="./test_js_list.js"></script>
    </html>""".strip())
cat test_js_list.html
yooo that just worked.
let's go.
so now I want to see if I can get a list to show up in a js file and print it to console.
with open("test_js_list.js", "w") as js_file:
    js_file.write("js_list = " + str(js_list) + "\nconsole.log(js_list);")
with open("test_js_list.html", "w+") as html_file:
    html_file.write("""<html>
    <title>some title here</title>
    <script type="text/javascript" src="./test_js_list.js"></script>
    </html>""".strip())
holy crap this is actually working.
this is actually working.
import numpy as np
co2_dataset = np.loadtxt('co2_annmean_mlo.txt', dtype="float")
co2_dataset
no_floats_dataset = np.format_float_positional(co2_dataset[:,:])

# this actually works pretty nicely. the data set is in scientific notation
So all the above stuff didn't do anything as you can see but some how the data is printed out nicer below. I still can't figure out how this worked.
But I'm cool with it.
co2_dataset[0:3,:]
# so I want to see if I can convert it but first I don't need the last column

cut_co2_dataset = co2_dataset[:,:2]

# this slices off far column
cut_co2_dataset.shape # testing shape of array after column slicerooni
cut_co2_dataset[0,1] # taking samples for good measure
cut_co2_dataset[0,0] # another sample, here here
cut_co2_dataset[0:10,:] # not sure why it's not displaying in non scientific notation now.
Alright so now I will convert the array to a python list with a super lazy but awesome method .tolist(). Thanks numpy creators.
py_list_co2_data = cut_co2_dataset.tolist()
py_list_co2_data[0:10][:]
Going to try to write to files now.
with open("linegraph.html", "w+") as html_file:
    html_file.write("""<html>
    <title>some title here</title>
    <script type="text/javascript" src="./linegraphData.js"></script>
    <script type="text/javascript" src="./linegraph.js"></script>
    </html>""".strip())

with open("linegraphData.js", "w+") as js_data_file:
    js_data_file.write("linegraphData = " + str(py_list_co2_data))

with open("linegraph.js", "w+") as js_file:
    js_file.write("console.log(linegraphData)")
future changes for above script
- add the word "var" in front of array name
- add the script that imports pertinent js library (example: )
- add semi colon to end of array
- don't forget to add the container to the html file.
- make sure to read all of the code.
Good thing to review your code once in awhile. (once in a while being the operative phrase) Let's test that those statements above made files..
ls line*
Yeah buddy. Lettttttsss gooooo. Putting a break in between this here markdown and the shtuff below for future reference. Also I'm going to write right here that everything below this line is the start of another project
added from the future (oooooooooo): didn't realize that the below html would have actually just prevented all of the errors I just faced in making the graph work with the code that I used and wrote in the file from above.
alright so I have the basic build of automating the html file creation of this.
<html>
    <title>some title here</title>
    <script type="text/javascript" src="./linegraphData.js"></script>
    <script type="text/javascript" src="./linegraph.js"></script>
    <script type="text/javascript" src="./flotr2.min.js"></script>
    <div id="chart" style="width:600px; height:300px"></div>
</html>
# which a function could maybe look like this

def make_new_html_graph_file(name_of_html_file,name_of_js_file=None, name_of_data_file=None):
    """makes html file ready for rendering new graph that is loaded from js data file"""

    new_html_file_name = name_of_html_file + ".html"

    with open(new_html_file_name, "w+") as html_file:
        html_file.write("""
<html>
    <title>some title here</title>
    <script type="text/javascript" src="./linegraphData.js"></script>
    <script type="text/javascript" src="./linegraph.js"></script>
    <script type="text/javascript" src="./flotr2.min.js"></script>
    <div id="chart" style="width:600px; height:300px"></div>\n</html>
        """)
make_new_html_graph_file("fart")
ls
cat fart.html
was this all just to write "cat fart" in this blog post?
why yes. Yes it was.
alright alright alright here's the graph I promised from above.